
Abstract
Objectives
Primary liver tumors constitute one of the most common tumors. These are aggressive tumors with poor survival. Fluorodeoxyglucose (FDG) positron emission tomography/computed tomography (PET/CT), most commonly used functional imaging, shows limited tracer retention and poor tumor to background ratios (TBR). Novel 68Ga-fibroblast-activation-protein inhibitor (FAPI) PET/CT has shown better tracer uptake and detection efficacy in liver tumors. However, most of the available literature is limited to single center studies with limited number of patients. So, we tried to review and analyze the head-to-head comparison of 18F-FDG PET/CT and 68Ga-FAPI PET/CT in evaluation of liver tumors.
Methods
Literature available on head to head comparison of diagnostic accuracy of 18F-FDG PET/CT and 68Ga-FAPI PET/CT was searched in databases like PubMed, SCOPUS, EMBASE and Google Scholar for published original studies till April 2023. The relevant studies were selected and assessed using the Revised Tool for the Quality Assessment of Diagnostic Accuracy Studies-2 checklist. A random-effect model was used for calculating pooled sensitivity and specificity. They were represented with 95% confidence intervals (95% CI) and demonstrated in Forest plots. I-square statistic was used to assess heterogeneity in the studies.
Results
Pooled sensitivity and specificity of FAPI PET/CT and 18F-FDG PET/CT for detection of primary liver tumors was 94.3% (95% CI: 90.6-96.8%); 89.3% (95% CI: 71.8-97.7%) and 56.1% (95% CI: 49.7-62.5%); 96.4% (95% CI: 81.7-99.9%) respectively. Pooled sensitivity for detection of extrahepatic metastatic disease was 92.2% (range: 88.1-100%; 95% CI: 87.8-95.4%) and 72.4% (range: 69.8-76.5; 95% CI: 65.9-78.2%) respectively. Also, the maximum standardized uptake value (SUVmax) and TBR were higher for FAPI PET/CT than 18F-FDG PET/CT in the included studies.
Conclusion
Overall, FAPI PET/CT showed higher sensitivity for detection of liver tumors with better SUVmax and TBR than 18F-FDG PET/CT.
Keywords: Positron emission tomography/computed tomography, 18F-fluorodeoxyglucose, fibroblast-activation-protein inhibitors, liver cancers, hepatocellular cancer, cholangiocarcinoma
Introduction
Primary liver tumor comprises of two major histological types of cancers i.e., hepatocellular carcinoma (HCC) and cholangiocarcinoma (CC). HCC arises from the hepatocytes and is the most common type, comprising of ~75% of all liver tumors. While CC arises from biliary tree with in the liver and is the second most common liver cancer (~12-15% of all liver cancer). Overall, Liver tumors are fairly common and constitutes the 6th most commonly diagnosed cancer worldwide with an incidence of 4.7%. These are aggressive with 5-year survival as low as 18%. Liver cancer is the 4th most common cause of cancer-associated mortality worldwide (, ).
Liver tumors are usually diagnosed late, especially in countries like India where liver tumor screening is not common with only 13.6-23.7% of cases presenting at stages where curative treatment could be offered (, ).
Imaging plays a very important role in the evaluation of liver tumors. Unlike other malignancies, liver tumors, especially HCC can be diagnosed non-invasively without biopsy without histopathological confirmation. Diagnostic imaging modalities used in the staging and workup of liver tumors include ultrasonography, contrast-enhanced computed tomography (CECT), magnetic resonance imaging (MRI), and functional/hybrid (functional + anatomical) imaging modalities like 18F-fluorodeoxyglucose positron emission tomography/computed tomography (PET/CT) and recently introduced 68Ga-fibroblast-activation-protein inhibitor (FAPI) PET/CT ().
Functional imaging targets physiological functions which are hyper-represented in tumors compared to normal tissues. FDG targets glucose metabolism and enters the cell via GLUT transporters but is not metabolized like glucose and remains trapped in cells while FAPI is an inhibitor of FAP highly expressed on cancer-associated fibroblasts which constitute as high as 90% of gross tumor mass in some malignancies (, ).
18F-FDG PET/CT is the most commonly used functional imaging and has established its central role in a wide variety of malignant and non-malignant conditions. However, its role in liver tumors is limited mainly due to the presence of glucose-6-phosphatase, high expression of P-glycoprotein, lower expression of GLUT1 or GLUT2 especially in well to moderately-differentiated HCC and high background activity in the liver, thus limiting the FDG avidity of these tumors. Glucose-6-phosphatase present in high concentration in hepatocytes, can dephosphorylate glucose-6-phosphate and FDG-6-phosphate and this FDG then can exit from the cell. These reduces the tumor to background ratios (TBR) for liver tumors (, ). Liver tumors have high amount of stromal component and desmoplastic reaction and thus, FAPI avidity. This high FAPI avidity together with the low liver background results in better TBRs and sensitivity (). Recent literature suggests a higher sensitivity of FAPI ~87-100% compared to 65-92% for 18F-FDG PET/CT (). However, the limited literature available that compared the diagnostic performance of FDG vs. FAPI is mainly from single-center studies with a limited number of patients. Thus, we tried to meta-analyse these studies to highlight the diagnostic performance of 18F-FDG PET/CT vs 68Ga-FAPI PET/CT.
Materials and Methods
We did this meta-analysis by following the “Preferred Reporting Items for Systematic Reviews and Meta-Analyses” (PRISMA) statement which describes an evidence-based minimum set of items for reporting in systematic reviews and meta-analyses (). Ethical approval has been taken from the All India Institute of Medical Sciences Bhubaneswar Ethics Committee with approval number T/IM-NF/Nucl. Med/23/19 (date: 15.05.2023). As this is a meta-analysis of the already published articles and no patient is directly involved, so taking consent is no applicable.
Literature Search Strategy
A comprehensive literature search of PubMed, SCOPUS, Embase and Google Scholar databases was carried out to find relevant published articles performing head-to-head comparison of diagnostic accuracy of 18F-FDG PET/CT and 68Ga-FAPI PET/CT in evaluation of hepatic tumors. We used a search string made of following keywords: (1) “18F-FDG PET/CT” or “fluorodeoxyglucose PET” (2) “68Ga-FAPI PET/CT” or “fibroblast activating protein inhibitor” (3) “HCC” or “hepatic tumors” or “hepatocellular carcinoma” or “cholangiocarcinoma” or “liver tumors”.
The literature was searched with an upper time bracket up to 26th April 2023 with no lower time bracket or language restriction. Also, relevant references from the retrieved studies were screened for additional articles.
Selection Criteria
Studies fulfilling the following inclusion criteria were included: (a) original studies where both 68Ga-FAPI PET/CT and 18F-FDG PET/CT were performed in patients with hepatic tumors; (b) sufficient data to reassess sensitivity and specificity of both 68Ga-FAPI PET/CT and 18F-FDG PET/CT in patients with hepatic tumors; (c) appropriate reference standard was used (viz histopathological assessment and/or follow up); (d) the time interval between the 68Ga-FAPI PET/CT and 18F-FDG PET/CT ≤10 days.
The exclusion criteria were: a) articles not within the field of interest of this review; b) articles without head-to-head comparison of 68Ga-FAPI PET/CT and 18F-FDG PET/CT; c) the time interval between the 68Ga-FAPI PET/CT and 18F-FDG PET/CT >10 days; d) review articles, letters or editorials, comments, abstracts presented at conference; e) case reports or small case series (<5 patients), f) data overlap.
Quality Assessment and Data Extraction
The methodological quality of the selected studies was assessed by two investigators independently. Any disagreements were resolved through consultation or intervention by the third reviewer.
Quality of studies was assessed using the Quality Assessment of Diagnostic Accuracy Studies-2 (QUADAS-2) tool which primarily evaluates the risk of bias in patient selection, index test, reference standard, and the timing and flow of reference test ().
For each study, following details were extracted: Basic details like first author, year of publication, country of origin, study design (retrospective, prospective); characteristics of study population like gender and age, sample size, and technical aspects (injected activity of 18F-FDG and 68Ga-FAPI, time between injections and image acquisition); reference standard, clinical results or other diagnostic methods used (CT and MRI).
For each study, we tried to extract the number of True Positive, True Negative, False Positive, and False Negative findings for 18F-FDG PET/CT and 68Ga-FAPI PET/CT in the staging of hepatic tumors.
Statistical Analysis
We tried to obtain the sensitivity, specificity, from individual studies on a per-patient and per-lesion based analysis. Pooled data was presented with 95% confidence intervals (95% CI) and displayed using forest plots. Heterogeneity was estimated using the I-square index (I2). The area under the summary receiver operating characteristics curve was calculated to measure the accuracy of these methods.
Results
Literature Search
The primary electronic search of PubMed, SCOPUS, Embase and Google Scholar resulted in 175 relevant articles. Of these, 38 were duplicates. The titles of 137 articles were reviewed, out of which 112 were excluded due to following reasons: (i) not related to the topic (106); (ii) case report (); (iii) review articles (). Remaining 25 articles were selected, abstracts of which were reviewed by two reviewers PS and TS. Twenty-five full-text articles were selected for review. After screening the 25 full-text articles, we excluded 16 articles for the following reasons: (i) no head to head comparison was available; (ii) studies which included different types of tumors but data for liver cancer patients was not provided separately; (iii) studies included only patients with tumors negative on 18F-FDG PET/CT; (iv) the time interval between the 68Ga-FAPI PET/CT and 18F-FDG PET/CT >10 days. Finally, 9 eligible studies were included in this review. The process of selection of studies in the meta-analysis is depicted in PRISMA flowchart ().
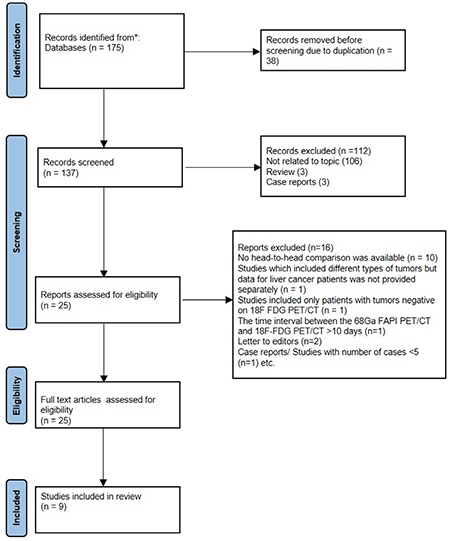
FAPI: Fibroblast-activation-protein inhibitors, 18F-FDG: Fluorine-18-fluorodeoxyglucose, PET/CT: Positron emission tomography/computed tomography, PRISMA: Preferred Reporting Items for Systematic Reviews and Meta-Analyses
Study Characteristics
The basic characteristics of the studies included in the final analysis are summarized in . A total of 9 studies were analysed, of these 7 studies were prospective while 2 were retrospective. Among the included studies, 3 studies compared the utility of FAPI PET/CT and FDG PET/CT in multiple malignancies. Chen et al. () included 75 patients, of which 11 were liver tumors and were included in the meta-analysis. Similarly, Pang et al. () included 64 patients with 15 types of malignancies, of which only 12 were liver tumors. While Lan et al. () evaluated 123 patients (102 oncologic and 21 non-oncologic), of which only 16 were liver tumors. The prospective pilot study for dedicated primary HCC was conducted by Shi et al. (). This study included 20 patients with primary HCC. Following this, Wang et al. () and Siripongsatian et al. () evaluated the utility of FAPI PET/CT in 25 and 27 liver tumor patients, respectively. Jinghua et al. () evaluated 47 patients with biliary tract tumors, of which 9 were excluded from the meta-analysis (5 benign and 4 gallbladder carcinoma) and the remaining 11 were included. Rajaraman et al. () evaluated 41 patients with suspected liver tumors, of which 7 had a final diagnosis of non-hepatic malignancies (6 gallbladder carcinoma and 1 peri-ampullary carcinoma) and the remaining 34 were included in the meta-analysis. Similarly, in study by Guo et al. () including 34 patients, 2 were benign while 9 had no histological proof, thus only 23 patients were included in the meta-analysis.
Table 1. Basic characteristics of the studies included in the systematic review
Authors | Year | Country | Study design | No. of patients | Imaging purpose | Blinding | Imaging analysis | Mean age (year) | Diagnostic criteria |
|---|---|---|---|---|---|---|---|---|---|
Chen et al. (12) | 2020 | China | P | 11 | Initial staging, relapsed | yes | V+Q | Median =61.5 | Histopathology |
Guo et al. (20) | 2021 | China | P | 23 | Initial staging | Yes | V+Q | Mean-60.6 | Histopathology |
Shi et al. (15) | 2021 | China | P | 20 | Initial staging | NR | V+Q | Mean-58 | Histopathology/follow-up |
Siripongsatian et al. (17) | 2022 | Thailand | R | 27 | Initial staging, relapsed | Yes | V+Q | Median =61.5 | Follow-up/MRI |
Wang et al. (16) | 2021 | China | R | 25 | Initial staging | Yes | V+Q | Mean-59.4 | Histopathology |
Pang et al. (13) | 2022 | China | P | 12 | Initial staging, relapsed | No | V+Q | Median =57.5 | Histopathology/ follow up |
Lan et al. (14) | 2021 | China | P | 16 | Initial staging, relapsed | Yes | V+Q | Mean-56.1 | CECT/MRI/ follow up |
Rajaraman et al. (19) | 2023 | India | P | 34 | Initial staging | NR | V+Q | NR | Histopathology/ MRI |
Jinghua et al. (18) | 2023 | China | P | 38 | Initial staging, relapsed | Yes | V+Q | Mean-59.09 | Histopathology/ follow up |
FAPI: Fibroblast-activation-protein inhibitors, 18F-FDG: Fluorine-18-fluorodeoxyglucose, PET: Positron emission tomography, CT: Computed tomography, NR: Not reported
All studies used 68Ga-FAPI PET/CT and 18F-FDG PET/CT. The technical details of the included studies are given in . All the included studies performed both qualitative (visual analysis) and semi-quantitative analysis. Semi-quantitative parameters of the included studies are given in .
Table 2. For technical characteristics of the studies included in the systematic review
Author | PET scanner | 68Ga-FAPI mean injected dose (MBq) | 18F-FDG mean injected dose (MBq) | Time interval between two scans | Scanning scope |
|---|---|---|---|---|---|
Chen et al. (12) | Discovery MI, GE Healthcare | 68Ga-FAPI-04 (1.8-2.2 MBq) | 18F-FDG (3.7 MBq/kg) | Within 1 week | From the head to the upper thighs |
Guo et al. (20) | Discovery MI, GE Healthcare | 68Ga-FAPI-04 (148-259 MBq) | 18F-FDG (3.7 MBq/kg) | Within 1 week | From the head to the upper thighs |
Shi et al. (15) | PoleStar m660, Sinounion Healthcare | 68Ga-FAPI-04 (3.59±0.47 MBq/kg) | 18F-FDG (3.7 MBq/kg) | Within 3 days | NG |
Siripongsatian et al. (17) | 64-slice Siemens Biograph vision scanner | 68Ga-FAPI-46 (2.59 MBq/kg) | 18F-FDG (2.59 MBq/kg) | Within 1 week | NG |
Wang et al. (16) | FAPI: mMI510, Union imaging FDG: Biograph mCT Flow scanner, Siemens | 68Ga-FAPI-04 (185 MBq) | 18F-FDG (NG) | Within 1 day | NG |
Pang et al. (13) | Discovery MI, GE Healthcare | Ga-FAP-2286 (1.8-2.2 MBq/kg) Ga-FAP-2286 (dose NG) | 288.1±28.4 MBq (227.5-332.4 | Within 1 week | NG |
Lan et al. (14) | uMI780, United Imaging Healthcare | 68Ga-FAPI-04 (1.85 MBq/kg) | 18F-FDG (3.7 MBq/kg) | Within 3 days | Skull base to upper thigh + separate head scan |
Rajaraman et al. (19) | Discovery DR, GE Healthcare | 68Ga-FAPI-04 (185- 370 MBq) | 18F-FDG (3.7 MBq/kg) | Within 1 week | NG |
Jinghua et al. (18) | NG | 68Ga-FAPI-04 (2.04 ± 0.22 MBq/kg) | 18F-FDG (3.7±0.19 MBq/kg) | Within 1 week | From the head to the upper thighs |
FAPI: Fibroblast-activation-protein inhibitors, 18F-FDG: Fluorine-18-fluorodeoxyglucose, PET: Positron emission tomography, CT: Computed tomography, MRI: Magnetic resonance imaging, NG: Not given
Table 3. Semi-quantitative parameters of FAPI PET/CT and 18F FDG PET/CT for the studies included in the systematic review
Study | Tumor | No. of patients | SUVmax mean/median | TBR mean/median | ||
|---|---|---|---|---|---|---|
FAPI | FDG | FAPI | FDG | |||
Chen et al. (12) | HCC + CC | 11 | Median: 16.18 (7.24-25.97) | 3.34 (2.08-10.7) | NR | NR |
Guo et al. (20) | HCC | 16 | Median: 11.47 (4.66-21.03) | 4.28 (3.25-10.81) | 4.97 (1.05-10.49) | 1.16 (0.96-4.21) |
CC | 7 | Median: 16.51 (8.34-23.21) | 4.22 (2.63-11.26) | 6.95 (2.15-10.62) | 1.49 (0.89-4.41) | |
Shi et al. (15) | HCC | 14 | Mean: 8.47±4.06 | 4.86±3.58 | 7.13±5.5 | 2.39±2.21 |
CC | 3 | Mean: 14.14±2.2 | 9.19±3.6 | 26.46±4.94 | 4.42±1.94 | |
Siripongsatian et al. (17) | HCC | 7 | Median: 9.65 (4.98-18.89) | 5.53 (3.37-23.23) | 7.9 (2.03-13.54) | 1.96 (1.25-6.95) |
CC | 12 | Median: 19.82 (5.27-30.25) | 4.89 (3.38-23.23) | 21.08 (3.59- 35.18) | 1.47 (0.98-7.74) | |
Wang et al. (16) | HCC only | 25 | Mean: 6.96±5.01 | 5.89±3.38 | 11.9±8.35 | 3.14±1.59 |
Pang et al. (13) | HCC + CC | 11 | Median: 11.3 (2.5-28.9) | 4.8 (3.1-9.7) | 5.2 (1.5-9.4) | 1.5 (1-3.5) |
Lan et al. (14) | HCC + CC | 16 | Mean: 10.22±5.32 | 6.16±5.07 | NR | NR |
Rajaraman et al. (19) | HCC | 6 | Median: 11.47 (10.8-12.07) | 13.4 (8.68-18.12) | 2.15 (2.04-2.27) | 4.72 (3.53-5.92) |
CC | 18 | Median: 17.7 (6.54-20.53) | 7.26 (4.42-16.3) | 7.15 (1.53-21.14) | 3.01 (1.86-5.66) | |
Jinghua et al. (18) | HCC | 38 | 17.25±6.72 | 10.80±5.22 | NR | NR |
FAPI: Fibroblast-activation-protein inhibitors, 18F-FDG: Fluorine-18-fluorodeoxyglucose, PET: Positron emission tomography, CT: Computed tomography, MRI: Magnetic resonance imaging, NR: Not reported, HCC: Hepatocellular carcinoma, CC: Cholangiocarcinoma, SUVmax: Maximum standardized uptake value
Quality Assessment
The quality assessment of the included studies was performed using QUADAS-2 (). The quality of the included studies is demonstrated in and , respectively.
Table 4. Quality Assessment of Diagnostic Accuracy Studies-2
Study, year | Risk of bias | Applicability concerns | |||||
|---|---|---|---|---|---|---|---|
Patient selection | Index test | Reference standard | Flow and timing | Patient selection | Index test | Reference standard | |
Chen et al. (12) | Low | Low | Low | Low | Low | Low | Low |
Guo et al. (20) | Low | Low | Low | Low | Low | Low | Low |
Shi et al. (15) | Low | Unclear | Low | Low | Low | Unclear | Low |
Siripongsatian et al. (17) | Low | Low | Low | Low | Low | Low | Low |
Wang et al. (16) | Low | Low | Low | Low | Low | Low | Low |
Pang et al. (13) | Low | High | Low | Low | Low | Unclear | Low |
Lan et al. (14) | Low | Low | Low | Unclear | Low | Low | Low |
Rajaraman et al. (19) | Low | Unclear | Low | Low | Low | Unclear | Low |
Jinghua et al. (18) | Low | Low | Low | Low | Low | Low | Low |
FAPI: Fibroblast-activation-protein inhibitors, 18F-FDG: Fluorine-18-fluorodeoxyglucose, PET: Positron emission tomography, CT: Computed tomography, MRI: Magnetic resonance imaging, NR: Not reported
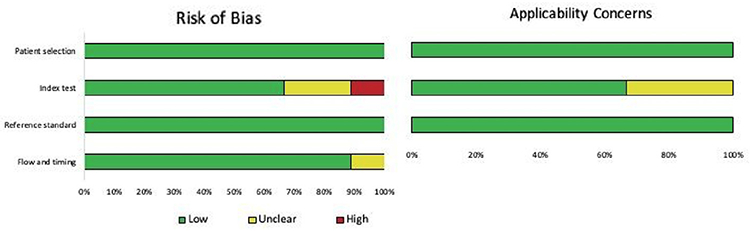
QUADAS-2: Quality Assessment of Diagnostic Accuracy Studies-2
Quantitative Analysis (Meta-analysis)
A total of 9 studies were included for the systematic review, however, complete data for quantitative analysis was not available for the included studies. The sensitivity and specificity for primary tumor detection was analysed on per- patient and per lesion basis as well as in terms of different histotypes i.e., HCC and intrahepatic cholangiocellular carcinoma separately. Diagnostic accuracy of FAPI PET/CT and 18F-FDG PET/CT in individual studies is given in .
Table 5. Diagnostic performance of FAPI PET/CT and 18F-FDG PET/CT in for evaluation of liver tumors
Author | No. of patients | FAPI PET/CT | 18F-FDG PET/CT | ||||||
|---|---|---|---|---|---|---|---|---|---|
Sensitivity (%) | Specificity (%) | Sensitivity (%) | Specificity (%) | ||||||
Value | 95% CI | Value | 95% CI | Value | 95% CI | Value | 95% CI | ||
Chen et al. (12) | 11 | 100 | 71.5-100 | NR | NR | 45.5 | 16.7-76.6 | NR | NR |
Guo et al. (20) | 23 | 95.7 | 78.1-99.9 | NR | NR | 65.2 | 42.7-83.6 | NR | NR |
Shi et al. (15) | 20 | 100 | 80.5-100 | 100 | 29.2-100 | 58.8 | 32.9-81.6 | 100 | 29.2-100 |
Siripongsatian et al. (17) | 27 | 100 | 82.4-100 | 75 | 34.9-96.8 | 52.6 | 28.9-75.6 | 87.5 | 47.3-99.7 |
Pang et al. (13) | 12 | 100 | 71.5-100 | 100 | 25-100 | 45.5 | 16.7-17.6 | 100 | 25-100 |
Lan et al. (14) | 16 | 100 | 79.4-100 | NR | NR | 75 | 47.6-92.7 | NR | NR |
Rajaraman et al. (19) | 34 | 95.8 | 78.9-99.9 | 90 | 55.5-99.7 | 45.8 | 25.6-67.2 | 100 | 69.2-100 |
Jinghua et al. (18) | 38 | 97.4 | 86.2-99.9 | NR | NR | 84.2 | 68.7-94 | NR | NR |
FAPI: Fibroblast-activation-protein inhibitors, 18F-FDG: Fluorine-18-fluorodeoxyglucose, PET: Positron emission tomography, CT: Computed tomography, CI: Confidence interval
For primary liver tumors (staging as well as recurrent tumors), per lesion analysis was performed in 9 studies and overall pooled sensitivity for FAPI PET/CT vs 18F-FDG PET/CT was 94.3% (range: 85.4-100%; 95% CI: 90.6-96.8%; I2: 62%) and 56.1 (range: 39.0-84.2%; 95% CI: 49.7-62.5%; I2: 65.8%) respectively (). While data for calculation of pooled specificity was available for 5 studies only and revealed a pooled specificity of 89.3% (range: 75-100%, 95% CI: 71.8-97.7%) for FAPI PET/CT and 96.4% (range 87.5-100%; 95% CI: 81.7-99.9%; I2: 0%) for 18F-FDG PET/CT (). The area under the curve (AUC) of 68Ga-FAPI was 0.956 while for 18F-FDG PET/CT was 0.682.
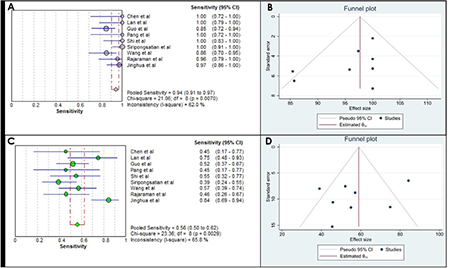
FAPI: Fibroblast-activation-protein inhibitors, 18F-FDG: Fluorine-18-fluorodeoxyglucose, PET/CT: Positron emission tomography/computed tomography, CI: Confidence interval
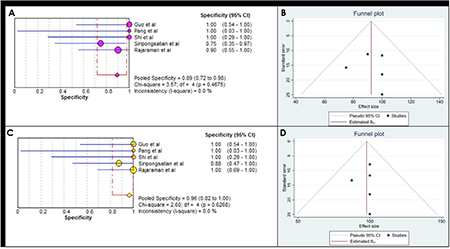
FAPI: Fibroblast-activation-protein inhibitors, 18F-FDG: Fluorine-18-fluorodeoxyglucose, PET/CT: Positron emission tomography/computed tomography, CI: Confidence interval
Per patient analysis for pooled sensitivity and specificity could be performed only in 8 and 4 studies, respectively. Sensitivity and specificity for FAPI PET/CT were 98.1% (range: 95.7-100%; 95% CI: 94.6-99.6%; I2: 0%) and 86.4% (range: 75-100%; 95% CI: 65.1-97.1%; I2: 0%) (, , , ) while for 18F-FDG PET/CT these were 62.9% (range: 45.5-84.2%; 95% CI: 54.9-70.4%; I2: 56.6%) and 95.5% (range: 87.5-100%; 95% CI: 77.2-99.9%; I2: 0%) respectively (, , , ). The AUC of 68Ga-FAPI was 0.989 while for 18F-FDG PET/CT was 0.702 (). The mean difference in the pooled sensitivity was statistically significant (p=0.02).
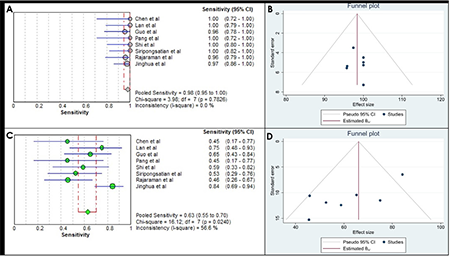
FAPI: Fibroblast-activation-protein inhibitors, 18F-FDG: Fluorine-18-fluorodeoxyglucose, PET/CT: Positron emission tomography/computed tomography, CI: Confidence interval
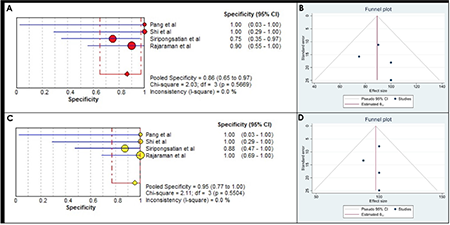
FAPI: Fibroblast-activation-protein inhibitors, 18F-FDG: Fluorine-18-fluorodeoxyglucose, PET/CT: Positron emission tomography/computed tomography, CI: Confidence interval
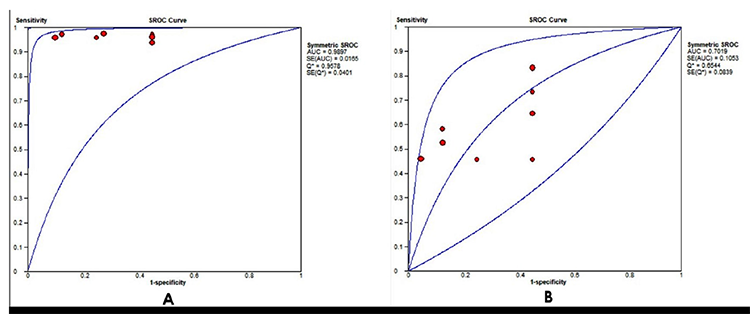
FAPI: Fibroblast-activation-protein inhibitors, 18F-FDG: Fluorine-18-fluorodeoxyglucose, ROC: Receiver operating characteristic, AUC: Area under the curve
For evaluation of individual histotypes, only 6 studies provided required information. For HCC patient-based analysis revealed a pooled sensitivity of 98.5% (range: 93.8-100%; 95% CI: 91.7%-100%; I2: 0%) for FAPI PET/CT and 60.9% (range: 40-75%; 95% CI: 47.9-72.9%; I2: 0%) for FDG PET/CT (). For CC, pooled Sn was 97.6% (range: 94.4-100%; 95% CI: 91.6-99.7%; I2: 0%) for FAPI PET/CT and 67.5% (range: 40-100%; 95% CI: 56.3-77.4%; I2: 63.5%) for FDG PET/CT (). The per-lesion analysis for the same is given in and .
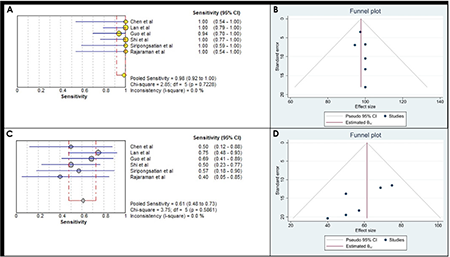
FAPI: Fibroblast-activation-protein inhibitors, 18F-FDG: Fluorine-18-fluorodeoxyglucose, PET/CT: Positron emission tomography/computed tomography, CI: Confidence interval
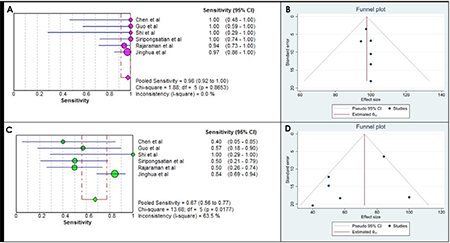
FAPI: Fibroblast-activation-protein inhibitors, 18F-FDG: Fluorine-18-fluorodeoxyglucose, PET/CT: Positron emission tomography/computed tomography, CI: Confidence interval
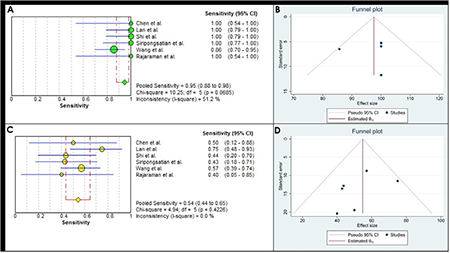
FAPI: Fibroblast-activation-protein inhibitors, 18F-FDG: Fluorine-18-fluorodeoxyglucose, PET/CT: Positron emission tomography/computed tomography, CI: Confidence interval
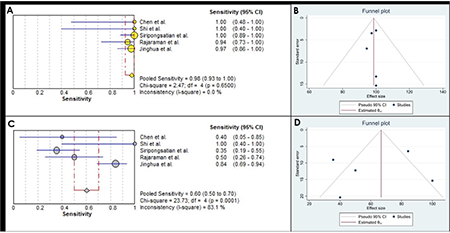
FAPI: Fibroblast-activation-protein inhibitors, 18F-FDG: Fluorine-18-fluorodeoxyglucose, PET/CT: Positron emission tomography/computed tomography, CI: Confidence interval
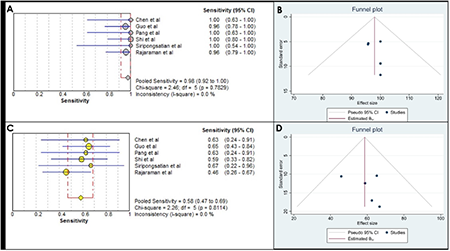
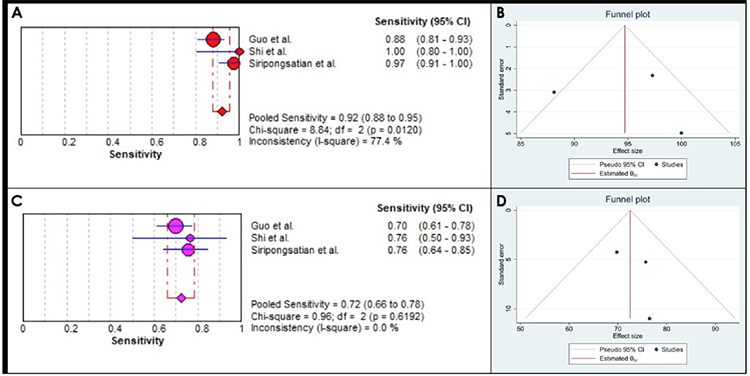
For detection of recurrent tumors, FAPI PET/CT showed much higher pooled sensitivity than 18F-FDG PET/CT. Pooled Sn for FAPI PET/CT was 100% (95% CI: 82.4-100%; I2: 0%), compared to 32% (95% CI: 13-57%; I2: 65.2%) for 18F-FDG PET/CT (). For primary tumor staging, FAPI PET/CT revealed pooled Sn of 97.7% (range: 95.7-100%; 95% CI: 91.9-99.7%; I2: 0%) while 18F-FDG PET/CT had pooled Sn of 58.1% (range: 45.8-66.7%; 95% CI: 47.0-68.7%; I2: 0%) () (). For detection of extrahepatic metastatic disease, pooled sensitivity could be evaluated only in 3 studies (). FAPI PET/CT had a pooled Sn of 92.2% (range: 88.1-100%; 95% CI: 87.8-95.4%; I2: 77.4%) while for FDG PET/CT pooled Sn was 72.4% (range: 69.8-76.5%; 95% CI: 65.9-78.2%; I2: 0%) ().
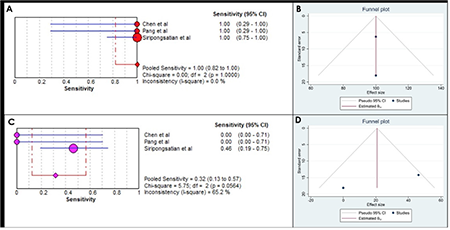
FAPI: Fibroblast-activation-protein inhibitors, 18F-FDG: Fluorine-18-fluorodeoxyglucose, PET/CT: Positron emission tomography/computed tomography, CI: Confidence interval
FAPI: Fibroblast-activation-protein inhibitors, 18F-FDG: Fluorine-18-fluorodeoxyglucose, PET/CT: Positron emission tomography/computed tomography, CI: Confidence interval
Table 6. Pooled diagnostic sensitivity and specificity of the analysed data
No. of studies | FAPI PET/CT | 95%CI | 18F-FDG PET/CT | 95% CI | ||
|---|---|---|---|---|---|---|
Per patient analysis | Pooled Sn | 8 | 98.1% | 94.6-99.6 | 62.9% | 54.9-70.4 |
Pooled Sp | 4 | 86.4% | 65.1-97.1 | 95.5% | 77.2-99.9 | |
Per lesion analysis | Pooled Sn | 9 | 94.3% | 90.6-96.8 | 56.1% | 49.7-62.5 |
Pooled Sp | 5 | 89.3% | 71.8-97.7 | 96.4% | 81.7-99.9 | |
Staging | Pooled Sn | 6 | 97.7% | 91.9-99.7 | 58.1% | 47-68.7 |
Recurrent disease | Pooled Sn | 3 | 100% | 82.4-100 | 32% | 13-57 |
HCC per patient | Pooled Sn | 6 | 98.5% | 91.7-100 | 60.9% | 47.9-72.9 |
HCC per lesion | Pooled Sn | 6 | 95% | 88.0-98.0 | 54% | 44.0-65.0 |
CC per patient | Pooled Sn | 6 | 97.6% | 91.6-99.7 | 67.5% | 56.3-77.4 |
CC per lesion | Pooled Sn | 5 | 98% | 93.0-100 | 60% | 50.0-70.0 |
For extrahepatic metastasis | Pooled Sn | 3 | 92.2% | 87.8-95.4 | 72.4% | 65.9-78.2 |
FAPI: Fibroblast-activation-protein inhibitors, 18F-FDG: Fluorine-18-fluorodeoxyglucose, PET: Positron emission tomography, CT: Computed tomography, Sn: Sensitivity, Sp: Specificity, CI: Confidence interval, HCC: Hepatocellular carcinoma, CC: Cholangiocarcinoma
Table 7. Diagnostic performance of FAPI PET/CT and 18F-FDG PET/CT in for evaluation of extrahepatic metastasis
Author | No. of extrahepatic lesions | FAPI PET/CT Sensitivity (%) | 18F- FDG PET/CT Sensitivity (%) | ||
Value | 95% CI | Value | 95% CI | ||
Guo et al. (20) | 126 | 88.1 | 81.1-93.2 | 69.8 | 61-77.7 |
Shi et al. (15) | 17 | 100 | 80.5-100 | 76.5 | 50.1-93.2 |
Siripongsatian et al. (17) | 74 | 97.3 | 90.6-99.7 | 75.7 | 64.3-84.9 |
FAPI: Fibroblast-activation-protein inhibitors, 18F-FDG: Fluorine-18-fluorodeoxyglucose, PET: Positron emission tomography, CT: Computed tomography, CI: Confidence interval
FAPI: Fibroblast-activation-protein inhibitors, 18F-FDG: Fluorine-18-fluorodeoxyglucose, PET/CT: Positron emission tomography/computed tomography, CI: Confidence interval
All the studies included in the meta-analyses have compared the maximum standardized uptake value (SUVmax) and/or TBR values of 68Ga-FAPI PET/CT and 18F-FDG PET/CT in primary liver tumors. Overall, mean/median SUVmax was found to be higher in 68Ga-FAPI PET/CT compared to 18F-FDG PET/CT. However, in study by Rajaraman et al. (19) SUVmax when compared among different histotypes, SUVmax of HCC was higher for FDG PET/CT than FAPI PET/CT which was in contrast to the rest of the studies. No adverse event to FAPI or FDG PET/CT was reported in any of the included studies. No pharmacological or physiological effects occurred in responses to FAPI administration. None of the articles had declared any conflicts of interest.
Discussion
Liver malignancies represent one of the most common malignancies worldwide. Liver cancers are generally associated with poor prognosis. HCC, the most common liver tumor, carries a 5-year survival and disease-free survival as low as 15.6 and 21.5% respectively (). The survival depends on the stage at diagnosis with median survival of early, intermediate and advanced stages with preserved hepatic function being ~36, ~16 and ~6 months, respectively (). Some recent studies have reported improved survival reaching as high as 70% in early stages where curative treatment options are feasible, thereby making early diagnosis and accurate staging utmost important ().
FDG PET/CT is most common function modality used for oncological imaging. However, it has limited role in detection of primary liver tumors, especially in HCC where sensitivity is 40-68% compared to 68% for CECT (, ). Similarly, in CC, FDG PET/CT fails to offer any significant advantage over conventional imaging for primary tumor detection. FDG PET/CT is found advantageous mainly in detection of extra-hepatic metastatic disease where it has sensitivity of 77-100% compared to 51.3% for conventional imaging (). Current meta-analysis revealed a pooled sensitivity of 60.9% (95% CI: 47.9-72.9) for primary HCC and 67.5% (95% CI: 56.3-77.4) for primary CC with an overall sensitivity of 62.9% (95% CI: 54.9-70.4) for all primary liver tumors (-). For extrahepatic metastasis, our meta-analysis revealed a sensitivity of 72.4% (95% CI: 65.9-78.2) (-). Recent National Comprehensive Cancer Network guideline for hepatobiliary malignancies do not routinely recommend FDG PET/CT owing to its limited sensitivity, however, it is recommended in cases with equivocal findings due to its high specificity and predictive value (). To overcome these limitations of functional imaging, various strategies have been adopted including use of diagnostic CECT with FDG PET (18F-FDG PET/CECT) and use of novel radiotracers like 11C-acetate, 68Ga-FAPI, 8F-fluorocholine, 11C-choline, 68Ga-labeled asparagine-glycine-arginine etc.
FAPI targets the fibroblast activating protein, a type II transmembrane serine protease, present on cancer associated fibroblasts. These are overexpressed in majority of epithelial tumours as well as in tumors with prominent desmoplastic response like CC. The high expression of FAPs in liver tumors combined with low background liver activity improves the detection rate of liver cancer. FAPI PET/CT has shown sensitivity as high as 100% for detection of primary liver tumors as well as extrahepatic metastasis in some studies (). In our study, we found a pooled sensitivity of 98.5% (95% CI: 91.7-100) for primary HCC and 97.6% (95% CI: 91.6-99.7) for primary CC with an overall sensitivity of 98.1% (95% CI: 94.6-99.6) for all primary liver tumors. For extrahepatic metastasis, our meta-analysis revealed a sensitivity of 92.2% (95% CI: 87.7-95.4) (-).
Recently, Liu et al. () performed a meta-analysis comparing the diagnostic performance of FAPI PET/CT and 18F-FDG PET/CT in abdominopelvic malignancies. The authors also found higher primary lesion detection rate of 0.98 (95% CI: 0.95-1.00; I2 =22.58%, p=0.23) with FAPI PET/CT compared to 0.76 (95% CI: 0.63-0.87; I2 =82.48%, p=0.00) for FDG PET/CT. Similar to our study, the author found higher sensitivity for detection of metastatic disease with FAPI PET/CT [Sn-0.918 (95% CI: 0.900-0.933; I2 =98.2%)] compared to FDG PET/CT [Sn-0.714 (95% CI: 0.686-0.741; I2 =95.1%)] (). In the current meta-analysis, we also performed per lesion analysis of the pooled sensitivity and specificity for detection of hepatic lesions which revealed a sensitivity of 56.1% (95% CI: 49.7-62.5) for FDG vs. 94.3% (95% CI: 90.6-96.8) for FAPI PET/CT. These findings were in line with the previously published studies.
There are few short-comings associated with this meta-analysis like heterogeneity among the studies, the publication bias and small number of studies available for the subgroup analysis.
Conclusion
Overall, in the present meta-analysis we found a superior sensitivity of FAPI PET/CT compared to FDG PET/CT in both per patient and per lesion analysis of primary liver tumor detection. Also, sub-group analysis revealed superior sensitivity of FAPI PET/CT for detection of both HCC and CC as well as primary staging, recurrence detection and extrahepatic metastatic disease. Thus, 68Ga-FAPI appears promising and can replace FDG PET/CT for staging and work-up of liver tumors. However, FAPI is still in its naive stages and these results need to be further confirmed by larger, multicentric and prospective studies.
Ethics
Ethics Committee Approval: This study protocol was reviewed and approved by the Manisa Celal Bayar University Health Sciences Ethics Committee (decision no: 20.478.486/506, date: 19.08.2020). Informed consent was obtained from all subjects when they were enrolled.
Informed Consent: Written informed consent was obtained from all patients.
Authorship Contributions
Surgical and Medical Practices: G.M., C.S.A., Concept: G.M., Y.P., C.S.A., Design: G.M., E.S., Data Collection or Processing: G.M., Y.P., C.S.A., G.G., Analysis or Interpretation: G.M., Y.P., E.S., Literature Search: G.M., G.G., Writing: G.M., E.S.
Conflict of Interest: No conflict of interest was declared by the authors.
Financial Disclosure: The authors declared that this study has received no financial support.
Footnotes
Ethics
Ethics Committee Approval: Ethical approval has been taken from the All India Institute of Medical Sciences Bhubaneswar Ethics Committee with approval number T/IM-NF/Nucl. Med/23/19 (date: 15.05.2023).
Informed Consent: As this is a meta-analysis of the already published articles and no patient is directly involved, so taking consent is no applicable.
Authorship Contributions
Concept: P.S., G.K.P., K.A., Design: P.S., G.K.P., Analysis or Interpretation: T.S., G.K.P., K.A., Literature Search: P.S., A.R., Writing: P.S., T.S.
Conflict of Interest: No conflict of interest was declared by the authors.
Financial Disclosure: The authors declared that this study has received no financial support.
References
Dasgupta P, Henshaw C, Youlden DR, Clark PJ, Aitken JF, Baade PD. Global Trends in Incidence Rates of Primary Adult Liver Cancers: A Systematic Review and Meta-Analysis. Front Oncol 2020;10:171.
Sung H, Ferlay J, Siegel RL, Laversanne M, Soerjomataram I, Jemal A, Bray F. Global Cancer Statistics 2020: GLOBOCAN Estimates of Incidence and Mortality Worldwide for 36 Cancers in 185 Countries. CA Cancer J Clin 2021;71:209-249.
Shetty VV, Kellarai A. Comprehensive Review of Hepatocellular Carcinoma in India: Current Challenges and Future Directions. JCO Glob Oncol 2022;8:e2200118.
Musunuri B, Shetty S, Bhat G, Udupa K, Pai A. Profile of patients with hepatocellular carcinoma: An experience from a tertiary care center in India. Indian J Gastroenterol 2022;41:127-134..
Singal AG, Parikh ND, Rich NE, John BV, Pillai A. Hepatocellular Carcinoma Surveillance and Staging. 2019 Aug 6. In: Hoshida Y, editor. Hepatocellular Carcinoma: Translational Precision Medicine Approaches. Cham (CH): Humana Press; 2019.
Mori Y, Dendl K, Cardinale J, Kratochwil C, Giesel FL, Haberkorn U. FAPI PET: Fibroblast Activation Protein Inhibitor Use in Oncologic and Nononcologic Disease. Radiology 2023;306:e220749.
Cho KJ, Choi NK, Shin MH, Chong AR. Clinical usefulness of FDG-PET in patients with hepatocellular carcinoma undergoing surgical resection. Ann Hepatobiliary Pancreat Surg 2017;21:194-198.
Lu RC, She B, Gao WT, Ji YH, Xu DD, Wang QS, Wang SB. Positron-emission tomography for hepatocellular carcinoma: Current status and future prospects. World J Gastroenterol 2019;25:4682-4695.
Parida GK, Panda RA, Agrawal K. Impact of fluorine-18-fluorodeoxyglucose PET/computed tomography in staging of patients with gallbladder cancer: a systematic review and meta-analysis. Nucl Med Commun 2021;42:846-854.
Liu X, Liu H, Gao C, Zeng W. Comparison of 68Ga-FAPI and 18F-FDG PET/CT for the diagnosis of primary and metastatic lesions in abdominal and pelvic malignancies: A systematic review and meta-analysis. Front Oncol 2023;13:1093861.
Whiting PF, Rutjes AW, Westwood ME, Mallett S, Deeks JJ, Reitsma JB, Leeflang MM, Sterne JA, Bossuyt PM; QUADAS-2 Group. QUADAS-2: a revised tool for the quality assessment of diagnostic accuracy studies. Ann Intern Med 2011;155:529-536.
Chen H, Pang Y, Wu J, Zhao L, Hao B, Wu J, Wei J, Wu S, Zhao L, Luo Z, Lin X, Xie C, Sun L, Lin Q, Wu H. Comparison of [68Ga]Ga-DOTA-FAPI-04 and [18F] FDG PET/CT for the diagnosis of primary and metastatic lesions in patients with various types of cancer. Eur J Nucl Med Mol Imaging 2020;47:1820-1832.
Pang Y, Zhao L, Meng T, Xu W, Lin Q, Wu H, Zhang J, Chen X, Sun L, Chen H. PET Imaging of Fibroblast Activation Protein in Various Types of Cancer Using 68Ga-FAP-2286: Comparison with 18F-FDG and 68Ga-FAPI-46 in a Single-Center, Prospective Study. J Nucl Med 2023;64:386-394.
Lan L, Liu H, Wang Y, Deng J, Peng D, Feng Y, Wang L, Chen Y, Qiu L. The potential utility of [68 Ga]Ga-DOTA-FAPI-04 as a novel broad-spectrum oncological and non-oncological imaging agent-comparison with [18F]FDG. Eur J Nucl Med Mol Imaging 2022;49:963-979.
Shi X, Xing H, Yang X, Li F, Yao S, Zhang H, Zhao H, Hacker M, Huo L, Li X. Fibroblast imaging of hepatic carcinoma with 68Ga-FAPI-04 PET/CT: a pilot study in patients with suspected hepatic nodules. Eur J Nucl Med Mol Imaging 2021;48:196-203.
Wang H, Zhu W, Ren S, Kong Y, Huang Q, Zhao J, Guan Y, Jia H, Chen J, Lu L, Xie F, Qin L. 68Ga-FAPI-04 Versus 18F-FDG PET/CT in the Detection of Hepatocellular Carcinoma. Front Oncol 2021;11:693640.
Siripongsatian D, Promteangtrong C, Kunawudhi A, Kiatkittikul P, Boonkawin N, Chinnanthachai C, Jantarato A, Chotipanich C. Comparisons of Quantitative Parameters of Ga-68-Labelled Fibroblast Activating Protein Inhibitor (FAPI) PET/CT and [18F]F-FDG PET/CT in Patients with Liver Malignancies. Mol Imaging Biol 2022;24:818-829.
Jinghua L, Kui X, Deliang G, Bo L, Qian Z, Haitao W, Yaqun J, Dongde W, Xigang X, Ping J, Shengli T, Zhiyong Y, Yueming H, Zhonglin Z, Yong H, Yufeng Y. Clinical prospective study of Gallium 68 (68Ga)-labeled fibroblast-activation protein inhibitor PET/CT in the diagnosis of biliary tract carcinoma. Eur J Nucl Med Mol Imaging 2023;50:2152-2166.
Rajaraman V, Meenakshi LA, Selvaraj AJ, Pottakkat B, Halanaik D. Role of 68 Ga-FAPI PET/CT in Assessing Hepatobiliary Malignancies : A Prospective Pilot Study. Clinical Nuclear Medicine 2023;48:e281-e288.
Guo W, Pang Y, Yao L, Zhao L, Fan C, Ke J, Guo P, Hao B, Fu H, Xie C, Lin Q, Wu H, Sun L, Chen H. Imaging fibroblast activation protein in liver cancer: a single-center post hoc retrospective analysis to compare [68Ga]Ga-FAPI-04 PET/CT versus MRI and [18F]-FDG PET/CT. Eur J Nucl Med Mol Imaging 2021;48:1604-1617.
Ding J, Wen Z. Survival improvement and prognosis for hepatocellular carcinoma: analysis of the SEER database. BMC Cancer 2021;21:1157.
Colli A, Fraquelli M, Casazza G, Massironi S, Colucci A, Conte D, Duca P. Accuracy of ultrasonography, spiral CT, magnetic resonance, and alpha-fetoprotein in diagnosing hepatocellular carcinoma: a systematic review. Am J Gastroenterol 2006;101:513-523.
Lee SM, Kim HS, Lee S, Lee JW. Emerging role of 18F-fluorodeoxyglucose positron emission tomography for guiding management of hepatocellular carcinoma. World J Gastroenterol 2019;25:1289-1306.
Benson AB 3rd, Abrams TA, Ben-Josef E, Bloomston PM, Botha JF, Clary BM, Covey A, Curley SA, D’Angelica MI, Davila R, Ensminger WD, Gibbs JF, Laheru D, Malafa MP, Marrero J, Meranze SG, Mulvihill SJ, Park JO, Posey JA, Sachdev J, Salem R, Sigurdson ER, Sofocleous C, Vauthey JN, Venook AP, Goff LW, Yen Y, Zhu AX. NCCN clinical practice guidelines in oncology: hepatobiliary cancers. J Natl Compr Canc Netw 2009;7:350-391.